			GASLAB:ATMOSPHERE

WHAT IS IT?
-----------
   This model demonstrates the effect of a gravity on gas
molecules. It is one in a series of GasLab models that
use the same basic rules for what happens when molecules run
into each other. Each one has different features in order
to show different aspects of the behavior of gases.


   In this model, a gaseous "atmosphere" is placed above the
surface of a "planet", represented by a red line at the
bottom of the screen.  Every molecule is given additional
velocity downward during each tick, as it would get in a
gravitational field. The molecules bounce off the "ground".
They disappear if they reach the top of the screen, as if
they had escaped the planet's gravitational field.

   Molecules are modeled as perfectly elastic particles with
no internal energy except that which is due to their
motion. Collisions between molecules are elastic.  Particles
are colored according to speed -- blue for slow, green for
medium, and red for high speeds.

   The exact way two molecules collide is as follows:
1. Two turtles "collide" if they find themselves on the
same patch.
2. A random axis is chosen, as if they were two balls that
hit and this axis were the line connecting their centers.
3. They exchange momentum and energy along that axis,
according to the conservation of momentum and energy.
This calculation is done in the center of mass system.
4. Each turtle is assigned its new velocity, energy, and
heading.

HOW TO USE IT
-------------
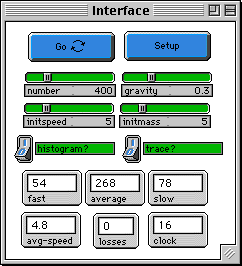
   To start set the number of molecules by setting the
NUMBER slider, the initial speed by setting the INITSPEED
slider, and set the initial mass of all particles by setting
the INITMASS slider.  The SETUP button will create the
molecules all with the same speed and mass, randomly
distributed over half of the box. The GO button will run the
simulation.  The GRAVITY slider determines the strength of
the gravitational field.
   As the simulation runs you can view a plot [DENSITY
HISTOGRAM (4)] that shows the the number of molecules at
different 'layers', i.e. the density of the atmosphere,by
clicking on the HISTOGRAM? button.  There are also histograms
of the overall speed and kinetic energy distribution.  The
path of one molecule is shown with the TRACE? button. SPEED
COUNTS (3) plots the number of molecules with each speed --
slow, average, fast.  This information is also shown on
monitors.

The "LOSSES" monitor shows the number of molecules that have
disappeared at the top edge of the screen.


RUNNING the MODEL
-----------------

        THINGS TO NOTICE
        ----------------

       Try to predict what the screen will look like after a while,
and why.

	Watch the yellow path of one molecule. What can you
say about its motion?

 	Watch the change in density distribution as the
model runs.

	As the model runs, what happens to the average speed and
kinetic energy of the molecules?  If they gain energy, where does
it come from?   What happens to the speed and
energy distributions?


        THINGS TO TRY
        -------------
	What happens when gravity is increased or decreased?


	Change the initial number, speed and mass.  What
happens to the density distribution?

	What factors affect how many molecules escape this
planet?

	Does this model come to some sort of equilibrium?
How can you tell when it has been reached?

       Try and find out if the distribution of the molecules
in this model is the same as what is predicted by
conventional physical laws.

	Try making gravity negative.

EXTENDING THE MODEL
___________

	Find a way to plot the relative "temperature" of the gas
as a function of distance from the planet.

	Try this model with molecules of different masses.  You
could color each mass differently to be able to see where they go.
Are their distributions different?  Which ones escape most easily?
What does this suggest about the composition of an atmosphere?

	Make the "planet" into a central point instead of a flat plane.

	This basic model could be used to explore other situations
where freely moving molecules have forces on them -- e.g. a centrifuge
or charged particles (ions) in an electrical field.
