WHAT IS IT?
------------
This model simulates the spontaneous decay of a
collection of radioactive nuclei. As they decay, the graph of the number that are
still radioactive demonstrates the notion of "half-life".

HOW TO USE IT
-------------
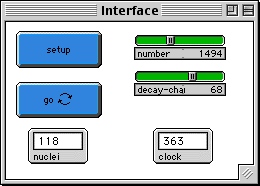
Set the initial number of nuclei (NUMBER slider) and
the likelihood of decay during each time interval (DECAY-CHANCE slider). Then
push the SETUP button. Push the GO button to run the model.  As each nucleus
decays, it flashes briefly, as if giving off radiation; then it turns from light
blue to dark blue and does not decay again.

The number of readioactive nuclei that remain are graphed in Plot Window 1. Each
time the number of nuclei is reduced by half, a red line appears on the graph.
Plot Window 2 shows the number of decays that occur during each clock tick.


THINGS TO NOTICE
----------------
What is the shape of the decay curve (Plot
Window 1)? How is this affected by the initial conditions?

Why is the decay curve this shape? Is it the same as the decay curve shown in
books?

The time between red lines is called the half-life. What is its physical meaning?
Is it constant as the number of nuclei decreases? Is it affected by the initial
number of nuclei or the decay-chance? Do you think it's a useful way to
characterize a radioactive material?

How long does it take for all the nuclei to decay?

Watch one nucleus carefully. When will it decay?

Radioactivity depends on the number of decays per unit time (Plot Window 2),
because each decay event gives off radiation.  What happens to the radioactivity
of this sample over time?  What is the shape of the decay rate curve?   How is it
related to the shape of the decay curve?

Examine the equation  N = No (e exp -(T/tau)), which is the standard formula for
nuclear decay.  (No is the initial number of nuclei, N is the number at a later
time T, and tau is the "mean lifetime".)  Compare its behavior to what you see in
this model.  The corresponding formula for radiation is  R = Ro (e exp -(T/tau)).
Why are these so similar?

THINGS TO TRY
-------------
What instructions would you give each turtle be to
make it behave like an unstable nucleus? Check the code and see if it's what you
thought it should be.

Try the extremes of the initial conditions: many or few nuclei, high or low
decay-chance.  How does this affect the "jaggedness" of the decay rate plot?

What does the graph do when very few nuclei are left?

EXTENDING THE MODEL
-------------------

Carbon-14 dating is comparing the ratio of a stable (C-12) to an unstable (C-14)
nucleus.  Explain that method in terms of this model.

It is often the case in nature that two nuclei with different decay rates are
present in the same sample.  Modify this model to have two or more types of
nuclei.  What happens to the radiation curve?

In this model, the nuclei don't affect their neighbors when they decay -- they
just disappear. Get them to emit particles that in turn cause reactions in other
nuclei. See if you can model a chain reaction. (see the model "Nuclear Reaction".