GPCEE HISTOGRAMS
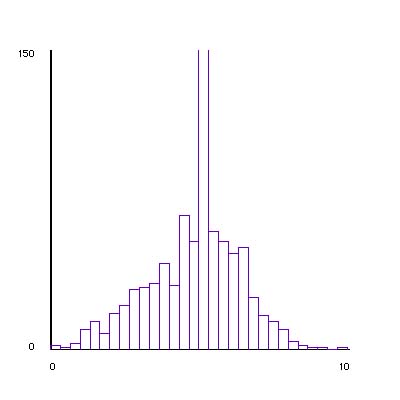
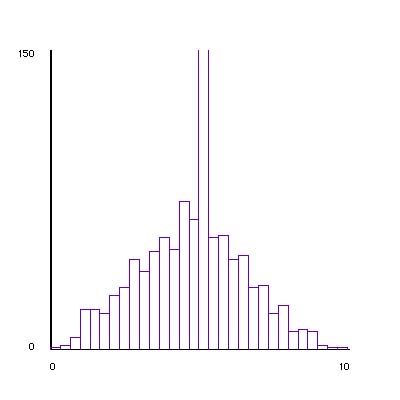
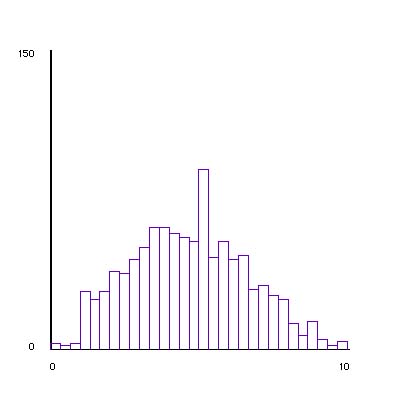
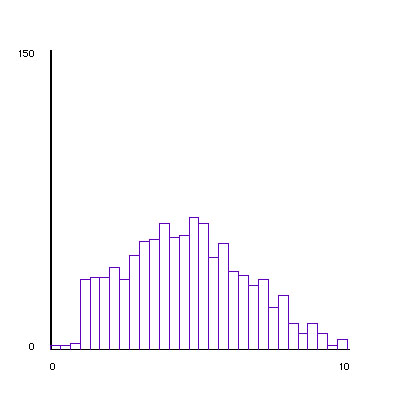
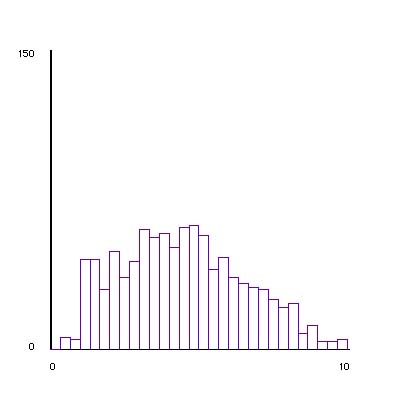
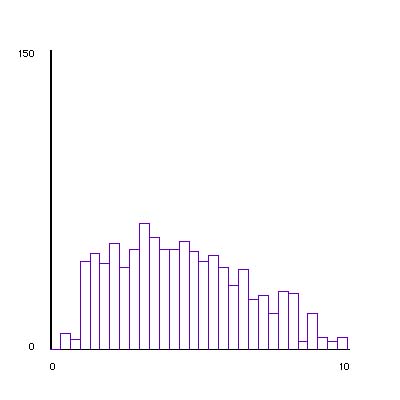
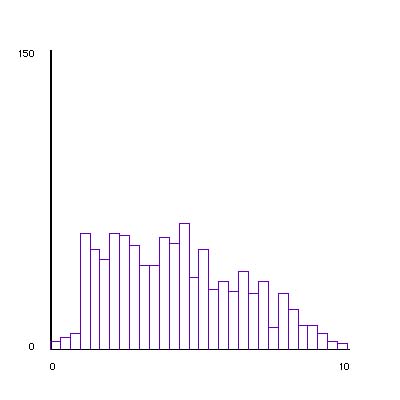
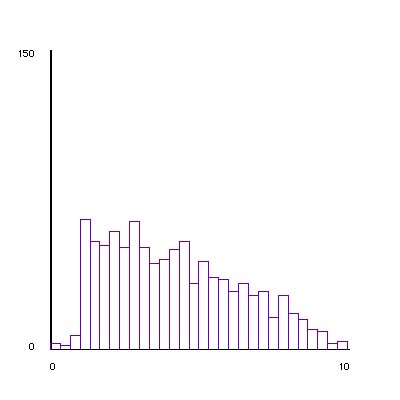
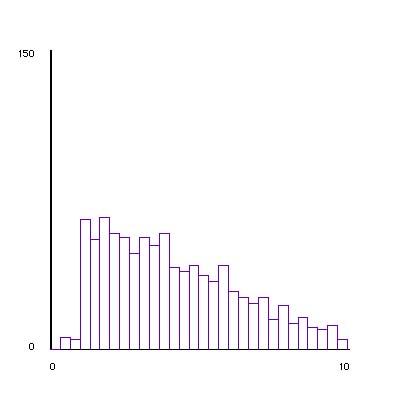
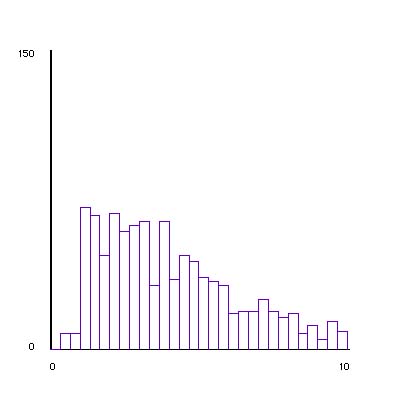
These GPCEE Histograms show the progression of the molecule velocity histogram from time 0 to time 400, with a setup of: 1000 molecules, intvelc = 5, intmass = 5. There are pictures every 20 ticks until time 200, and then pictures at times 300 and 400.
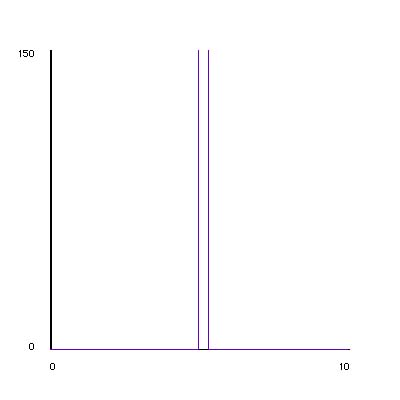 Time=0 |
 Time=20 |
 Time=40 |
 Time=60 |
|---|---|---|---|
 Time=80 |
 Time=100 |
 Time=120 |
 Time=140 |
 Time=160 |
 Time=180 |
 Time=200 |
 Time=300 |
 Time=400 |