				PERCOLATION

WHAT IS IT?
-----------

This model shows how an oil spill can percolate down through permeable soil.  It
was inspired by a similar model meant to be done by hand on graph paper (see
"Forest Fires, Oil Spills, and Fractal Geometry", Mathematics Teacher, Nov. 1998,
p. 684-5).

HOW TO USE IT
-------------
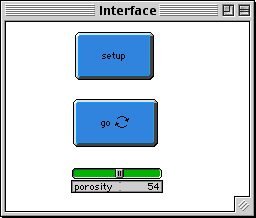
Push the SETUP button.  The oil spill is represented by red patches, which start at
the top of the screen.   They sink downward through the soil by moving diagonally
to the right or left with a certain probability, set by the POROSITY slider.  The
patches through which they spread represent the empty spaces in the soil, and the
POROSITY slider represents the soil's porosity.  In a more porous soil, the oil
would have a greater chance of continuing downward.  Press the GO button to run the
model.

It can be run as long as you like; it resets to the top of the screen when it
reaches the bottom.  It stops automatically when the oil spill stops advancing.

The two plotwindows show how large the leading edge of the spill is (red) and how
much soil has been saturated (blue).

THINGS TO NOTICE
-----------------
Try different settings for the porosity.  What do you notice about the pattern of
affected soil?  Can you find a setting where the oil just keeps sinking, and  a
setting where it just stops?

If  percolation stops a certain porosity, it's still possible that it would
percolate further at that porosity given a wider graphics window.

Note the plot of the size of the leading edge of oil.  Does the value settle down
roughly to a constant?  How does this value depend on the porosity?

EXTENDING THE MODEL
-------------------
Give the soil different porosity at different depths.  How does it affect the flow?
In a real situation, if you took soil samples, could you reliably predicat how deep
an oil spill would go?

Limit the total amount of oil that is spilled -- how many empty spaces it will fill
up.  Given that and the porosity, can you predict the depth of the spill?

STARLOGOT FEATURES
------------------

This is a good example of a cellular automata model, because it uses only patches.
It also uses a simple random-number generator to give a probability, which in turn
determines the average large-scale behavior.

This is also a simple example of how plot windows can be used to reveal,
graphically, the average behavior of a model as it unfolds.


RELATED MODELS
--------------

"Fire" is a very similar model.  In both cases, there is a rather sharp cutoff
between halting and spreading forever.