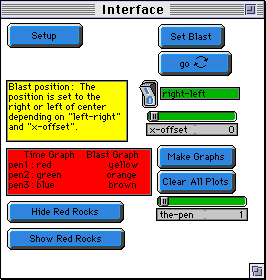
WHAT IS IT? ----------- This model is loosely based on the geological concept of velocity profiles. Seismologists use the travel times of seismic waves in combination with computer modeling software to determine these profiles within the earthąs crust and mantle. In some instances geologists will purposefully set off explosions on the earthąs surface in combination with sensors on the ground to time the speed of the explosionąs shock wave through the ground. The principle behind this technique is that shock waves travel fast through hard rock and slow through soft rock. Additionally, waves that hit the mantle or some other change in rock type at an oblique enough angle will reflect, and waves that hit at an acute angle will diffract. In this model these properties are simplified. Waves originate from a single blast source, they go faster through red rock, and they reflect off of the mantle. HOW TO USE IT -------------- The mantle is represented by the black strip at the bottom of the screen. Soft rock is colored brown and hard rock is colored red. To start a new simulation click the "setup" button. This will remove all red patches from the simulation and initialize the screen. To draw red rocks (color 15), use the drawing tools to draw in the graphics window. Position the blast source using the "right-left" switch and the "x-offset" slider. Set it off using the Set Blast button. To make a blind simulation hit the button titled "Hide Red Rocks". This will make the red rocks invisible in the simulation window. The button "Show Red Rocks" will make them visible. The graphs in this simulation are operated using two controls. The button "Clear All Plots" clears all of the pens and "Make Graphs" creates a set of three graphs. The execution of the simulation occurs in two phases. The first wave released goes faster through red rock and is referred to as a modifiable wave. The second wave travels at uniform speed through all materials and is referred to as an unmodifiable wave. The y-axis is the return time of the wave and the x-axis is the horizontal position of the sensor receiving the wave. Plot window three is a composite graph of unmodified return time minus modified return time. The composite graph is useful for visualizing subtle differences between the two graphs. THINGS TO NOTICE ---------------- The shape of the unmodified wave is a parabola. The equation of the graph is: 2 * Square Root ( ( .5 * xcor ) ^ 2 + ( Mantel Depth) ^ 2 ). The composite graph is intended to illustrate differences between the modified and unmodified graphs. Notice that with rectangular shapes there are multiple critical points on the graph. Some portions of the wave may travel through a rock formation twice. How does this change the shape of the graph? THINGS TO TRY ------------- Create a simple shape out of red rocks and hide it using the "Hide Red Rocks" button. Have someone else use the model and ask them to predict what the shape and placement of the formation is. Try to find critical points on the graph. Especially in the case of a square formation there should be some critical points. Try to explain these points with the geometry of the rock formation. As an investigative technique try creating waves from different locations around the rock formation. Use the "the-pen" slider to fit multiple plots on the same composite graph. EXTENDING THE MODEL ------------------- Try to create a better system or equation for visualizing the red rock formations. To do this make modifications to the procedure "graphit". Implement diffraction between rock surfaces in the model. Try to imagine how this would change the shape of the graphs. Try implementing different rock types with different densities using a new rock color. STAR LOGO FEATURES ------------------ Many of the graphs have dips in them. These imperfections are points without data and should be ignored. The procedure "random-real" uses the shift-right primitive. The number 65535 is equal to 2^16 1. Or in binary it is 1111 1111 1111 1111. The decimal part of a starlogo number is stored in the low word. Random 65535 shift-right 16 creates a random number between one and zero. When added to an integer it forms a "random-real" number.