Highway Traffic Simulation
IntroductionMy final project for Cs 395: Projects with Netlogo is a traffic wave experiment. I got the idea from the website that Sharona T. Levy reffered to us. The url to this website is http://www.amasci.com/amateur/traffic/trafexp.html
-- Stuff from the William Beaty's website --
|

Rationale
William Beaty, the author of this website describes how he was able reduce the phenomenon of traffic waves by paying attention to the traffic around him and adjusting his speed so that he did not add to the traffic jam and let it eat away itself before he reached it. I decided that I would try to create a model which let users control one car among many so that we could see if these experiments actually work. In this model there are many android cars that follow a basic set of preprogramed rules. Each hubnet user is assigned a car that follows the same rules as he android cars but the user is allowed to control the maximum speed it moves at. In this way the user can control the line of cars that follow him and depending on his strategy, can either add to traffic jams or help get rid of them.
The above graphic of the cars coming into the traffic jam is Mr. Beaty's representation of a stationary traffic wave. I found that the cars in my model also behave simalarly as can be seen from this image.

How the Model works
You can see how the cars coming into the traffic jam have to reduce speed and the ones coming out accelerate out fast but the traffic jam stays staitonary.
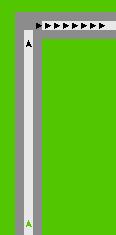
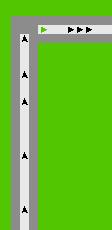
The image on the left shows the green user controlled car approaching the traffic jam. Its speed was reduced so that by the time it reached the traffic jam, it had been reduced to a much smaller size as can be seen from the image on the right which was taken a few seconds larer. Also it can be seen that the cars behind the green car are following without any crowding or traffic.
Discussion and Analysis of Model Results
I have been running tests on this model with one user controlled car (using the __hubnet-client command). Here are some of the observations.
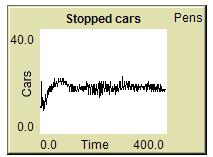
For the above plot, the model was allowed to run for a while without the addition of any user controlled cars. You can see that there is an initial surge in the number of cars that are standing still (in a traffic jam) and then it remains more or less constant.
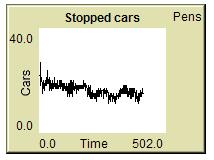
For this plot, all the starting conditions were kept the same but one user controlled car was introduced and then controlled to try to decrease the traffic jams in the way described above. As you can see, although there was one more car in the model, overall the number of cars that are standing still have decreased. This shows that it is actually possible for one car to make a difference in traffic jams. The differences in the two plot are not very great but they are constant as I have tested this more than a few times. Maybe more than 1 car will produce greater reduction in the number of cars stuck in the traffic jam.
The actual model
WHAT IS IT?
-----------
This is a model that mimics the behavior of cars on a highway. When used without connecting any clients to it merely behaves as traffic on the highway would do. A user can connect to it using hubnet. Then, it gives control of the speed of a car. The user can see how adjusting his own car's speed can have effects in the traffic patterns.
HOW IT WORKS
------------
The computer controlled cars have basic rules like slowing down when in traffic and accelerating when on an open road. They have variables for top speed and acceleration. They are also programmed to turn at the corners of the graphic screen sp that they always move in a continuous loop.
HOW TO USE IT
-------------
This model can be used without starting up hubnet at all. Then it would give the user an idea of what typical highway traffic looks like. When a user connects through hubnet, he can control one cars top speed. By observing the traffic patterns around him, he can control his cars speeds to help dissipate traffic waves. The plot on server screen gives an idea if the users and having a positive or negative impact on reducing traffic.
THINGS TO NOTICE
----------------
The user should notice the standing traffic wave phenomenon. Cars come in and go out of the traffic jam at high speeds but have to slow down while in it.
THINGS TO TRY
-------------
The user should try to go slow into the traffic jams so that they dissipate as much as possible before he hits them.
Other links
Modified
NetLogo model
Modified
Hubnet model host
Modified
Hubnet model Client
Netlogo
Project First Proposal
First
weekly project report
Week
2 Progress Report
Post-presentation Report