Equidistant Probability is perhaps an unusual model -- it bridges two domains of mathematics that are seldom found on the same page: geometrical analysis and probability.
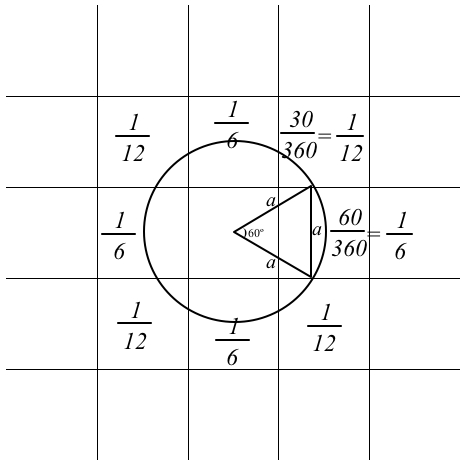
Say you have selected three vertices and have arranged them so that they flank a single square (e.g., Preset3). Slow down the model, using the slider on the top-left corner of the graphics window, and watch closely what happens when you press FIND EQUIDISTANT POINT. From each of the three vertices, a single turtle darts forward in some random direction. The turtles walk in discrete steps of a size that is equal to the side of a square. If all three turtles land on the same spot, then that spot is equidistant from their respective points of departure. The diagram, below, helps compute the chance of each turtle landing on a square that is neighboring its own square. The collection of all points that a turtle can land on when heading at a random direction and stepping forward 1 step describes a circle of radius 1 step. Geometrical analysis of arcs of this circle that lie in neighboring squares shows that the arc is 1/6 of the circle. So the turtle has a 1/6 chance of landing on each of the four North/West/South/East neighbors. 4/6 are 2/3, so 1/3 is left to share between the four corners. So the turtle has a 1/12 chance of landing on each of the four corner neighbors. Your three turtles each has a 1/6 chance of landing in the square their vertices enclose. To determine the likelihood of the compound event when all three turtles each got just that 1/6 of a chance, we multiply the three chances. 1/6 * 1/6 * 1/6 is 1/216. So once in every 216 attempts, on average, all three turtles will land on that square. Run the experiment under these conditions and see if you get a mean of 216 attempts until success.

The EPICENTER module (bottom-left corner of the interactive model) uses brute force to compute the chances of a single turtle landing on some square. From the central square, 10,000 turtles emerge. Their orientation is distributed quite uniformly. Then, all at once, the turtles perform a synchronized swim 1 step forward. The squares where the turtles land each record how many turtles landed on them. This information is displayed by default as a percentage of all landings, but you can change the 'choice' button so as to see the number of landed turtles instead. Use this module to cross-check the diagram. With paper, pencil, straightedge, and compass, you can try extending the diagram to determine if you have understood well the geometrical analysis. In NetLogo, this model can be easily extended so as to include more squares and allow the turtles to walk more steps. The richness of such extension possibly trades off with a multitude of data that makes for challenging computation.
You can read about the building of this model in this PDF.
Questions to Ponder
- What is the connection between the following three variables: #attempts, mean-attempts-to-success, and the mean of the Successes-Per-Sample histogram?
[Last updated April 7, 2005]