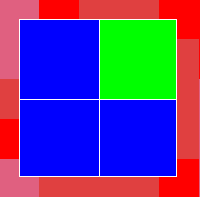
ProbLab Genetics demonstrates some connections between Probability and the Natural Sciences. Specifically, the model frames a combinatorial space in terms of a genetic pool… of fish. Fish vary by body and fin color, each of which can be either green or blue. Underlying this variation are dominant and recessive genes, expressed in "4-blocks." A "4-block" (see example, below) is a 2-by-2 array of squares, each of which can be either green or blue (see also 9-BLock Stalagmite). Initially, fish are randomly distributed by genotype, so if you add enough fish -- using the ADD FISH button -- they will be more or less equally distributed by genotype. Then, when you press GO ONCE or GO, the fish swim around, mate, and reproduce, and the distribution changes. The model allows you to look "under the hood": You can study a Mendel-type visualization of the combinations of dominant and recessive genes that underlie changes and trends in genetic distribution.

A "4-block" Example
The top row of the "4-block" represents the body color of the fish, and the bottom row represents its fin color. Each row contains two squares, which represent the combination of genes that determine the phenotype of that fish. Green is the dominant gene for both the body and the fin color, whereas blue represents the recessive gene for those attributes. Thus, a green-green top row makes for a green body color and so does green-blue and blue-green. Only a blue-blue top row would give a blue body color. The same applies to the bottom row, with respect to fin color. For example: the fish with these genes (in the "4-block" picture, above) would have a green body and a blue fin.
The fish swim around randomly. If at least two fish are on the same square (a NetLogo "patch"), they might mate, as long as they follow the pre-set mating rules (see the MATE-WITH chooser). When they mate, the offspring’s genotype, both for the body color and the fin color, is built as a pair of squares—one from each parent. (For each parent, the procedure picks randomly between the left and right squares of each row.) Thus, it is possible for two fishes with green bodies to beget a blue-bodied fishlet. To view a fish's genetic code, press the REVEAL GENES button and then click on this fish. If you press on a mating fish (on a yellow patch), you will see the genetic code of both parents and of the offspring (who has already swum to a different place in the pool). This code will appear in the top white panel of the model as an "equation."
Use the LIFE-SPAN slider to control the number of "years," or time-steps, a fish lives. Note that for low life-span values, your fish population may deplete, and for higher values, the population might grow sharply but eventually arrive at an equilibrium, at a point that is determined by the life-span and mating rules.
When the experiment runs, note that the monitors in the top-right corner show the number of fish by phenotype. The "Percent Fish by Properties" graph, too, shows the fish by phenotype, only this graph shows the percent of the fish with the four possible phenotypes out of all the fish in the pool. This graph helps us track changes in the population's make-up over the course of the experiment. Finally, there is a "4-Block Distribution" histogram. This histogram, unlike the other displays, deals with fishes' genotype. The histogram shows how many 4-blocks of each type there are (there are 5 types that are represented: 4-blocks with 0 green, 1 green, 2 green, 3 green, and 4 green squares). The little monitor in the top-right corner of this histogram, "Mean z," gives the mean number of green squares in the genetic material of the entire fish population. For example, if the population were normally distributed by genotype, the Mean z would be 2. That means that there would be 2 out of 4 green squares, on average, in the 4-blocks underlying the fishes' appearance.
Questions to Ponder
What is the critical setting of the LIFE-SPAN slider that keeps the population from depleting when the simulation is run? How, if at all, does this depend on the setting of the MATE-WITH choice button and on the initial size of the population?
If you set the MATE-WITH choice button to "SAME BODY," fish will only mate with other fish that have the same body color and they do (they could differ in fin color). How do you expect this should affect trends in the distribution of fish by phenotype, as viewed in the "Percent Fish by Properties" graph?
Press SETUP and then press ADD FISH 10 times. Watch the group of monitors in the top-right area of the model. What can you say about the distribution of fish by body and fin color? Why is this distribution quite consistent each time you repeat this little activity? Why do we get this specific initial distribution?
[last updated July 8, 2005]