CM ProbLab: S.A.M.P.L.E.R. -- A classroom participatory simulation for learning statistics
Don't see nothin'?
Explanation of some features in the server interface
Gist
S.A.M.P.L.E.R., Statistics As Multi-Participant Learning-Environment Resource, is a group activity. The applet is a stripped-down version of the 'server' -- what all participants see projected on a large screen. It has been stripped down to key interactivity features both so as to fit in this window and so as to cut to the core of the design. For further details, please refer to the Computer-HubNet Guide.
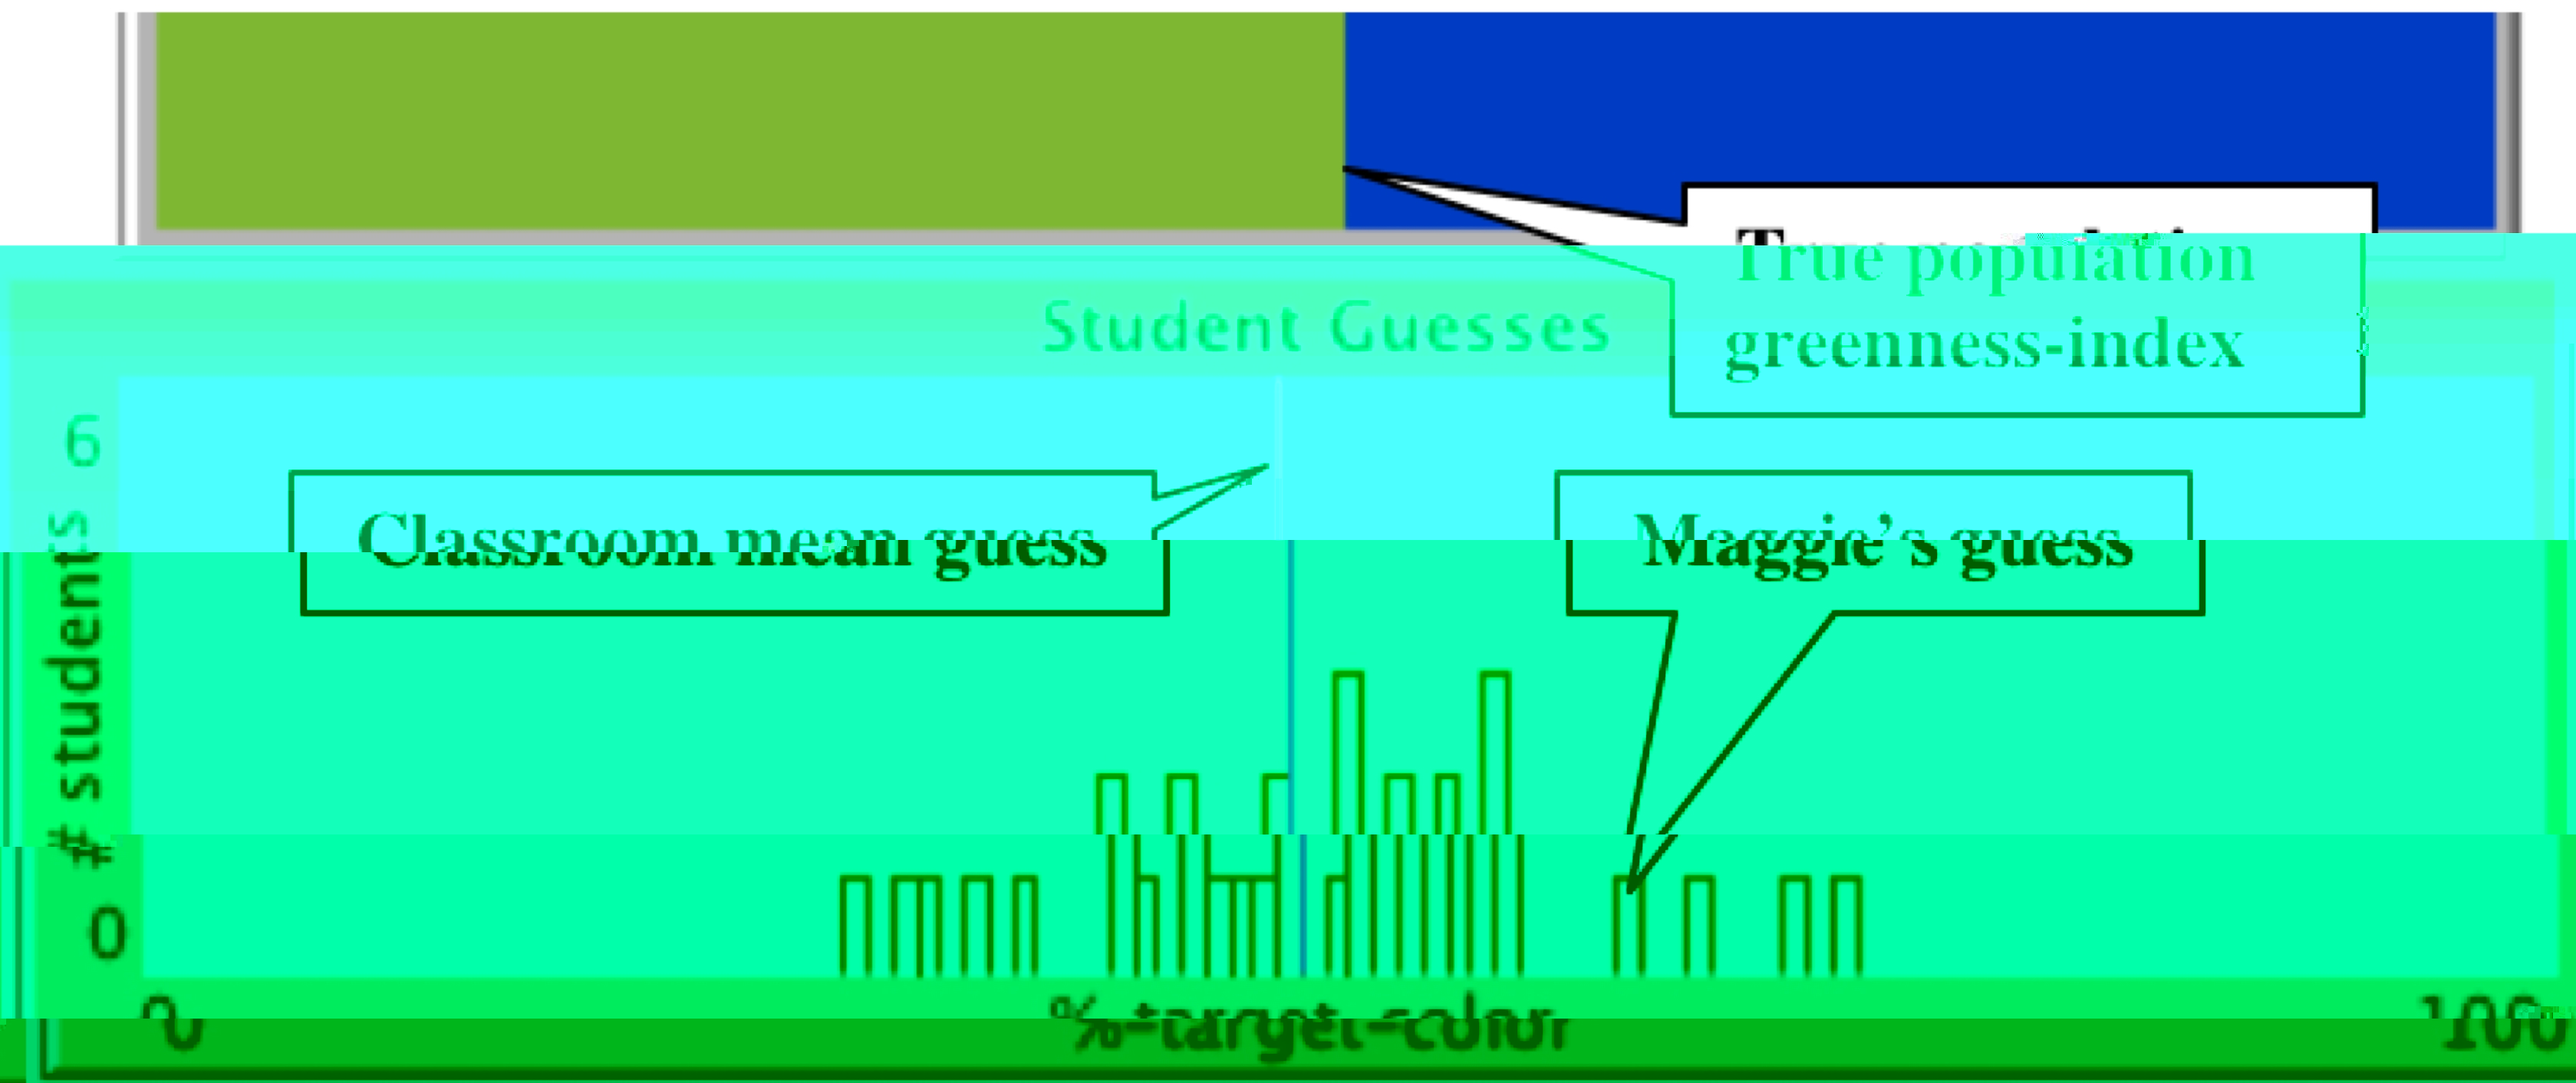
The objective in this model is to determine, through sampling, the greenness of the population. That is, if you were to pick a single tiny square from this "population" of thousands of green-or-blue squares, what is the chance that this square comes out green? Press on 'Sample,' and then click on the graphics window. Using the appropriate slider and switches, you can change the size of the sample with the sample-block-side slider, you can add a grid, and you can keep your samples. In the classroom, each student has their own computer interface from which they make their individual selections of samples. Then they input their guesses. Click on 'Simulate Classroom Histogram' to get a sense of how these guesses might look once they are processed by the central server.
Working with middle-school student in S.A.M.P.L.E.R. has been very exciting. See our publications for some reports, analyses, and feedback. S.A.M.P.L.E.R. is much richer than we can convey in this forum -- it includes many game-full activities that draw in students' intuitions and mathematical skills and build on these towards creating a meaningful context for asking difficult questions about statistics, questions that help students reason about the domain and develop deep understandings. We hope we can help you make S.A.M.P.L.E.R. happen for you, too![Last updated January 3, 2005]