 Wolf-Sheep Predation 2:
 Peter M. Roy > MAM course > Buffalo-Applet
 Wolf-Sheep Predation 2:
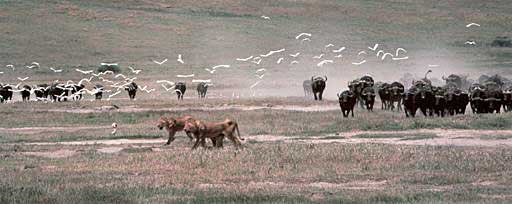
If attacked, the adults in the
herd form a circle around the young and face outward. By lowering their heads
and presenting a solid barrier of sharp horns, it is difficult for predators to
seize a calf. This effective group defense even allows blind and crippled
members of the herd to survive. Thus predators do not have a major impact on
buffalo herds; it is the old, solitary-living males that are most likely to be
taken by lions.
- African Wildlife Foundation
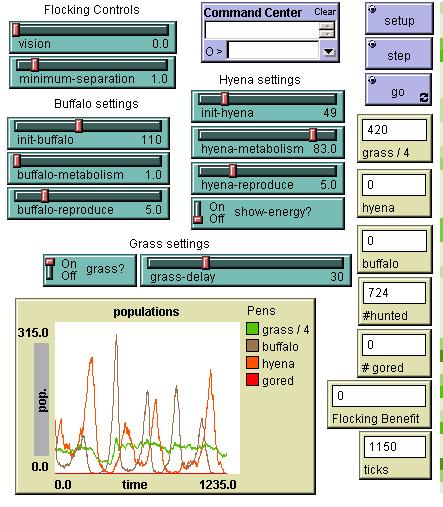
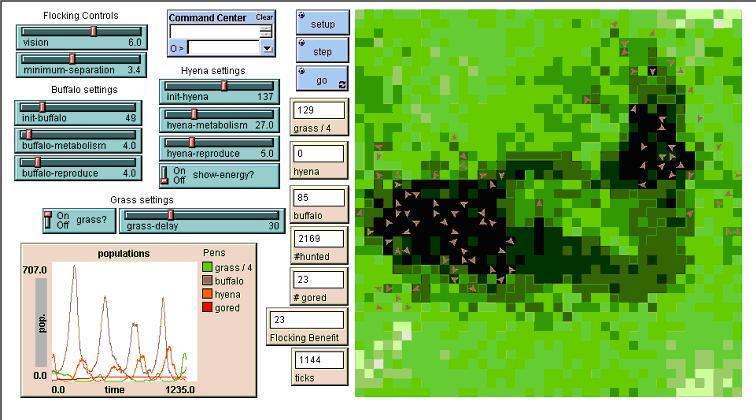
The wolf-sheep predation model has been modified so that the prey (represented by buffalo) now exhibit flocking behavior and that in turn has a negative effect on their number killed by carnivores (represented by hyena).
Applet created with Netlogo
view/download model file: buffalo.nlogo
Predation Model with Flocking behavior (v 1.0)
WHAT IS IT?
-----------
This model extends (Wilensky, U. (1998).
NetLogo Wolf Sheep Predation model) to explore the stability of predator-prey
ecosystems. Such systems are called unstable when they tend to result in
extinction for one or more species involved. In contrast, systems are stable
when they tend to maintain themselves over time, despite fluctuations in
population sizes. The basic Predation Model had two major variants, one in which
the grazing rate of the prey (sheep) was considered and another where it was
not.
Realistically, preyed animals tend to exhibit flocking behavior as a defense against predators. This is especially true for middle-to-large sized animals where there is greater safety in numbers. (Nishimura, 1998) refers to a number of such scenarios, in particular quoting examples of Canadian musk oxen and African eland. Flocking behavior is modeled using (Wilensky, U. (1998), Flocking model)
( In version 1.0 of the model )Like the wolf-sheep predation model, this model presents two variants - the behavior with grazing rate considered and that without.
HOW TO USE IT
-------------
1. (For version 1.0)Set the GRASS? switch
to TRUE to include grass in the model, or to FALSE to only include hyena
(orange) and buffalo (brown).
2. Adjust the slider parameters (see below), or
use the default settings.
3. Press the SETUP button.
4. Press the GO
button to begin the simulation.
5. View the POPULATIONS plot to watch the
populations fluctuate over time
6. Various monitors give output values.
Parameters:
INIT-BUFFALO : The initial size of buffalo population
INIT-HYENA : The initial size of hyena population
(For version 1.0)
BUFFALO-METABOLISM: The amount of energy buffalo get for every grass patch
eaten
HYENA-METABOLISM: The amount of energy hyena get for every buffalo
eaten
BUFFALO-REPRODUCE: The probability of a buffalo reproducing at each
time step
HYENA-REPRODUCE: The probability of a hyena reproducing at each
time step
(For version 1.0)GRASS?: Whether or not to include grass in the
model
(For version 1.0)GRASS-DELAY: How long it takes for grass to regrow
once it is eaten
Notes:
- one unit of energy is deducted for every step a hyena takes
-
when grass is included, one unit of energy is deducted for every step a buffalo
takes
THINGS TO NOTICE
----------------
* Relative population
fluctuation.
* Flocking behavior of buffalo.
THINGS TO TRY
-------------
* Adjusting the slider for
minimum-separation affects the density of the flock.
* Ajusting the vision
affects. Vision = 0, is as good as no flocking.
* Turn the grass on and off.
Some interesting test cases:
1) Turn flocking off (VISION = 0) and the rest of the setting close to the one below. Several "near-extinction" events occur for both species. The changes tend to be dramatic.

2) Try varying the flocking controls (vision and separation) to bring the flock closer together when their numbers dwindle and to allow them to spread out when there is relatively less threat (predator population down). Again, there are several cycles.

EXTENDING THE MODEL
-------------------
* Hyena extinction is more due
to decreased probability of finding prey. Hyena should hunt smarter.
*
Min-separation can be made to vary dynamically with the population (low
population - tighter flocks due to perceived threat of extinction).
CREDITS AND REFERENCES
----------------------
Wilensky, U. (1998),
NetLogo Wolf Sheep Predation model.
Wilensky, U. (1998), Flocking
model
Nishimura,S. and Ikegami, T. (1998), Emergence of Collective Strategies
in a Prey-Predator Game Model
CREDITS AND REFERENCES (from
wolf-sheep predation)
----------------------
Wilensky, U. & Reisman,
K. (1999). Connected Science: Learning Biology through Constructing and Testing
Computational Theories -- an Embodied Modeling Approach. International Journal
of Complex Systems, M. 234, pp. 1 - 12. (This model is a slightly extended
version of the model described in the paper.)
Wilensky, U. & Reisman,
K. (in press). Thinking like a Wolf, a Sheep or a Firefly: Learning Biology
through Constructing and Testing Computational Theories -- an Embodied Modeling
Approach. Cognition & Instruction.
To refer to this model in academic
publications, please use: Wilensky, U. (1998). NetLogo Wolf Sheep Predation
model. http://ccl.northwestern.edu/netlogo/models/WolfSheepPredation. Center for
Connected Learning and Computer-Based Modeling, Northwestern University,
Evanston, IL.
Please forward comments on the flocking variant to:
Peter M Roy, 2145 Sheridan Rd #MEAS-C230, Evanston, IL 60208-3119
pete @ iems . nwu . edu
Created and coded by: Peter M Roy Peter M Roy Peter M Roy Peter M Roy Peter M Roy
Page last
updated 19 January 2003