Mind the Gap
An agent-based participatory simulation (ABPS) curricular unit on wealth inequality
Project Overview

The goal of Mind the Gap (MTG) curricular unit is to help high school students understand important mechanisms of wealth inequality in the U.S. through the lens of complex systems with NetLogo HubNet-based participatory activities.
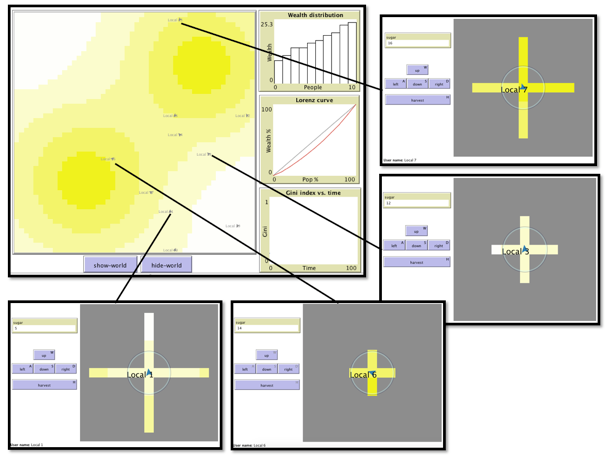
Agent-based participatory simulations (ABPSs) are collaborative learning activities for students to collectively experience and explore the interrelationship between "micromotives" and "macrobehavior" in agent-based models. In a regular ABM, computer controls the behavior of agents, but in a PartSim, each student takes control of an agent in the model (Figure 1).
Curriculum Design
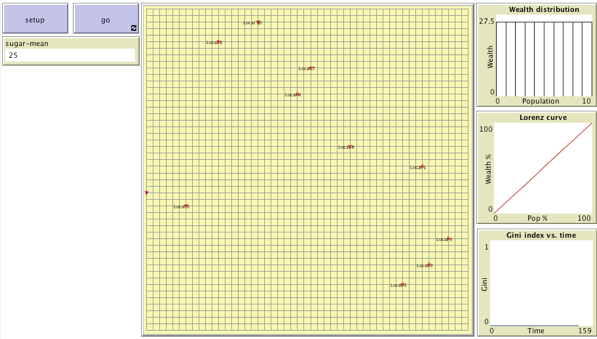
MTG consists three ABPS, the design of which was informed by the SugarScape agent-based models (Epstein & Axtell, 1996; Li & Wilensky 2009). In these MTG models, the simulation space consists two major parts: 1) the “land”, where resources (sugar) can be harvested to become people’s wealth; 2) the people, each of which is an avatar controlled directly by a student, who competes with other students to harvest the most sugar and become the wealthiest in the simulation. The land is represented by a 51 by 51 checkerboard. Each tile on the checkerboard contains certain amount of sugar. The people have randomly assigned traits and are randomly placed on the checkerboard (Figure 2).

Figure 2 shows the teacher’s view of the MTG Equality model (Guo & Wilensky, 2018a)—the first of three in this unit. At the center of the view is the checkerboard. The unicolor of yellow in this model shows that each tile contains the same amount of sugar. The three plots on the right—a bar graph, a Lorenz curve, and a Gini index plot—show three frequently used graphs of representation economic inequality. The plots update in real time by aggregating the amount of sugar that students own. The “setup” and “go” buttons at the upper left corner initialize and run the model. The “sugar-mean” monitor shows the average of sugar that students own.
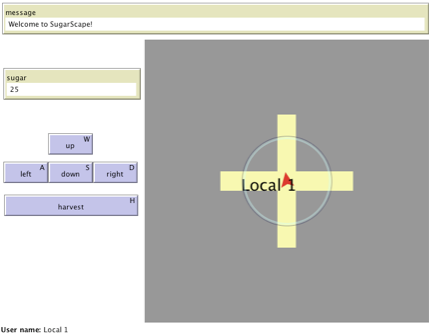
Students see a different view from the teacher (Figure 3). The red arrowhead at the center of the view is a student’s avatar. Because the avatar has only imperfect local knowledge about its surroundings, it can only see a few tiles away in each direction. The yellow cross represents the field of view of the avatar. A Student can use the “up”, “down”, “left”, and “right” buttons on the left to move their avatar around and explore the surroundings. He or she can also use the “harvest” button to collect sugar from the tiles they are on. The “sugar” monitor above the buttons show the current amount of sugar that the avatar owns. The “message” bar at the top shows real time tips and warnings about the student’s behavior.

Students have a few attributes: 1) Vision: how many steps (tiles) away a student can see. 2) Endowment: how many units of sugar a student starts with. 3) Metabolism: how many units of sugar is needed for moving one step or doing one harvest. Students have some actions they can take: 1) Move: by clicking the direction buttons or the keyboard shortcuts, students can move around. Each click moves the student by one step and burns metabolism amount of sugar. 2) Harvest: by clicking the harvest button, students harvest all the sugar on the tile that he or she is standing on. One harvest burns metabolism amount of sugar.
MTG curricular unit consists a series of three models: 1) Equality, in which students experience the emergence of inequality even when everyone starts with equal opportunities; 2) Randomness, in which students and 3) Feedback (with education as an example). Each subsequent model builds on the previous one with added complexity that more closely resembles the real world (Figure 4).

For each model, the teacher facilitates the students to go through a five-step inquiry cycle: introduction, 2) question, 3) simulation, 4) reflection, and 5) connection (Figure 5).

In Step 1, students are introduced to the interface and rules of the model. In Step 2, students are asked to think about what makes rich people rich and poor people poor in that specific model. In Step 3, students play the simulation and compete to become the wealthiest person. In Step 4, whole class discussions are held for students to reflect on their experience in the model: who was the richest in this round? How did s/he achieve it? What was his or her starting condition? Who was the poorest? Why did s/he end up being poor? The richest and the poorest students are asked to share their stories in the simulation with the whole class. In Step 5, group discussions and whole class discussions are held for students to make connections between their simulation experience and the real-world: What are the real-world analogies of vision, endowment, metabolism, and the color of the starting tile? What is a real-world version story of the richest student? What is a real-world version story of the poorest student? Students go through these five steps of inquiry cycle in each activity and keep revisiting the question about why the rich are rich while the poor are poor in different models. The increased complexity in each activity is expected to contribute to students’ more sophisticated thinking about the question.
School Implementations
The unit was implemented in two schools with distinctive demographics: a private catholic school in an affluent neighborhood and a public school in a highly ethnically diverse neighborhood near a large Midwestern city in the USA. a total of 207 students (156 from 6 Honors economics classes in the private school and 51 from 2 AP economics classes in the public school) participated in the study. Students from both schools spent about 166 minutes on the unit over 4 to 5 consecutive days (three 55-minute lessons in the private school and four 42-minute lessons in the public school)
Data Collection
Multiple types of data were collected. The pre- and post- questionnaires collect data on students’ knowledge and attitudes toward wealth inequality before and after the unit. During the unit, students’ typed responses to questions about each simulation are collected through input boxes built in the MTG models. Computer log data of all students’ interactions with the models (including key strokes and performance) were collected. Whole class video recordings captured the class dynamics throughout the four days. A total of 38 students (3 from each class in the private school, 10 from each class in the public school) were selected in consultation with their economics teacher as focal students to represent the racial and gender diversity. Two additional types of data were collected from the focal students: 1) Pre- and post- clinical interviews, in which researchers probed students’ thoughts and attitudes toward wealth inequality through structured and follow-up questions. 2) Screen recordings: Focal students’ computer screens were recorded using Camtasia screen grabbing software, which records on-screen behavior and conversations between students.
Initial Analysis and Findings
We analyzed students' responses to the Likert scale attitudinal questions using non-parametric statistics, such as Wilcoxon tests, and found that in both schools, there are significant changes in attitude toward wealth inequality before and after the unit. Males and conservatives showed greater changes than females and liberals, who had high awareness of inequality to begin with.
Researchers
Yu (Bryan) Guo and Uri Wilensky
Publications
Guo, Y., & Wilensky, U. (Under Review). Changing High School Students’ Perceptions of Wealth Inequality in the U.S. through Agent-based Participatory Simulations.
Guo, Y., & Wilensky, U. (2018a). Mind the gap: Teaching high school students about wealth inequality through agent-based participatory simulations. In Proceedings of the Constructionism 2018 conference. Vilnius, Lithuania.
Guo, Y., & Wilensky, U. (2018b). Running vs. Being: Comparing Two Modalities of Simulation-Based Learning in High School Economics Classes. Poster presented at the annual meeting of the American Educational Research Association (Special Interest Group: Learning Sciences), New York, NY, April 13-17.
Software
Guo, Y., & Wilensky, U. (2018c). NetLogo HubNet Mind the Gap Equality HubNet model. http://ccl.northwestern.edu/netlogo/models/HubNetEqualityHubNet. Center for Connected Learning and Computer-Based Modeling, Northwestern University, Evanston, IL.
Guo, Y., & Wilensky, U. (2018d). NetLogo HubNet Mind the Gap Randomness HubNet model. http://ccl.northwestern.edu/netlogo/models/HubNetRandomnessHubNet. Center for Connected Learning and Computer-Based Modeling, Northwestern University, Evanston, IL.
Guo, Y., & Wilensky, U. (2018e). NetLogo HubNet Mind the Gap Feedback HubNet model. http://ccl.northwestern.edu/netlogo/models/HubNetFeedbcakHubNet. Center for Connected Learning and Computer-Based Modeling, Northwestern University, Evanston, IL.
Curriculum
Guo, Y., & Wilensky, U. (2018f). Mind the Gap curriculum. http://ccl.northwestern.edu/MindtheGap. Center for Connected Learning and Computer-Based Modeling, Northwestern University, Evanston, IL.
Acknowledgements
This project is supported by NSF ITEST Grant # 1614745.