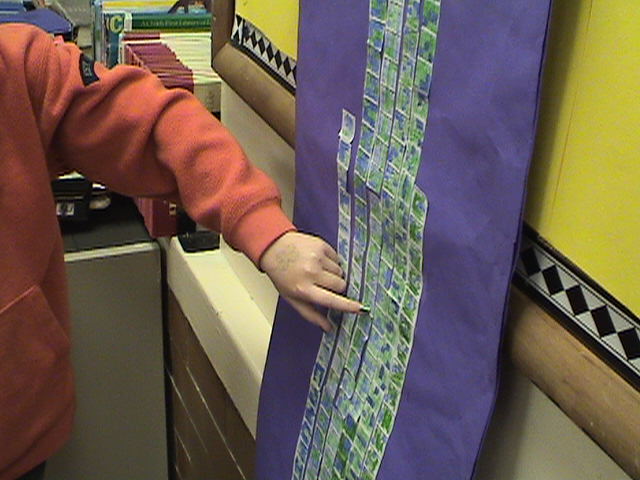
Figure 1: A student points to one of the 9-blocks that she had personally created for the classroom Combinations Tower (on left).
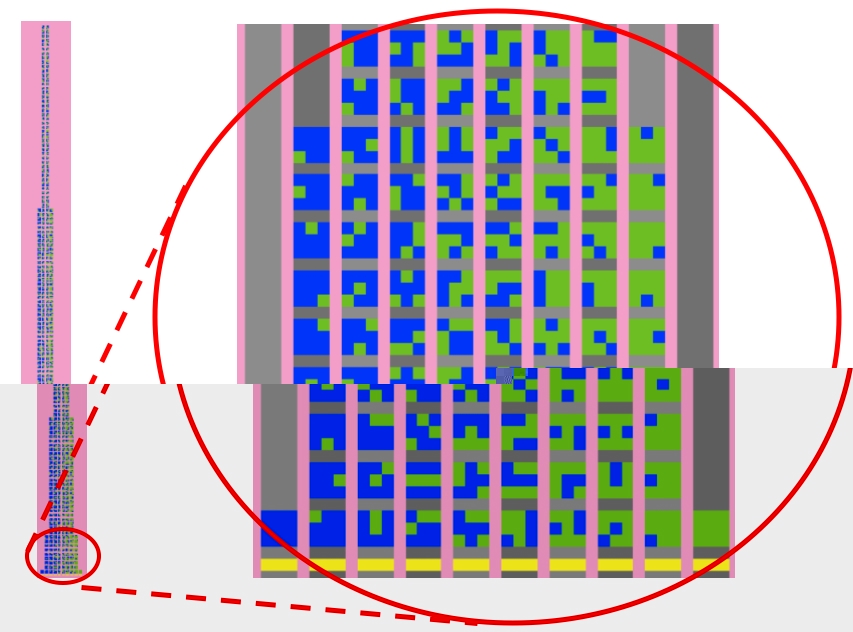
The Combinations Tower with magnified detail, created in the NetLogo ProbLab model '9-Block Stalagmite' (on right).
The Combinations Tower (Figure 1, below) is the collection of all possible permutations of the green/blue 9-block. These permutations are grouped by combinations, that is according to the number of green squares in each 9 block (0, 1, 2, 3, 4, 5, 6, 7, 8, and 9 green). These unique permutations are placed one above the other. The heights of the Combinations Tower's respective columns, counted in 9-blocks, is the sequence of binomial coefficients for (a+b)9, that is: 1, 9, 36, 84, 126, 126, 84, 36, 9, and 1. The Combinations Tower becomes a classroom resource for referring to elements in subsequent activities in the ProbLab unit. For instance, in the SAMPLER statistics activities, one can refer to sample means, e.g., 2/9 green or 8/9 green, in terms of their left-right "location" in the tower, and one can refer to sample-mean distributions as compared to the quasi-normal distribution of the tower. Thus, the tower supports the classroom co-construction of the semiosis of the domain -- the tower helps bring together the unit's three conceptual pillars: theoretical probability, empirical probability, and statistics.
Figure 1: A student points to one of the 9-blocks that she had personally created for the classroom Combinations Tower
(on left).
The Combinations Tower with magnified detail, created in the NetLogo ProbLab model '9-Block Stalagmite' (on right).
It is no simple task for a middle-school classroom to build the Combinations Tower. Individual students use inductive, deductive, recursive, and pattern-finding algorithms to determine the heights of the columns and to generate the permutations. There is a great deal of work to accomplish, and resources are limited. So students need to distribute the work to task forces. The biggest challenge is avoiding repeated permutations. So the mathematical construct of distribution is grounded in terms of classroom agents, labor, and product. The Combinations Tower that students engineer and build becomes associated with probability when explored through the NetLogo models, such as 9-Blocks (see Figure 2, below). The combinatorial space is distributed in a form that anticipates the frequency distributions in empirical experiments. Reciprocally, the distribution resulting from the experiment lends new meaning to the actions of performing combinatorial analysis. That which was essentially a collection of all different permutations now becomes a representation of the relative ubiquity of classes of objects in the world.
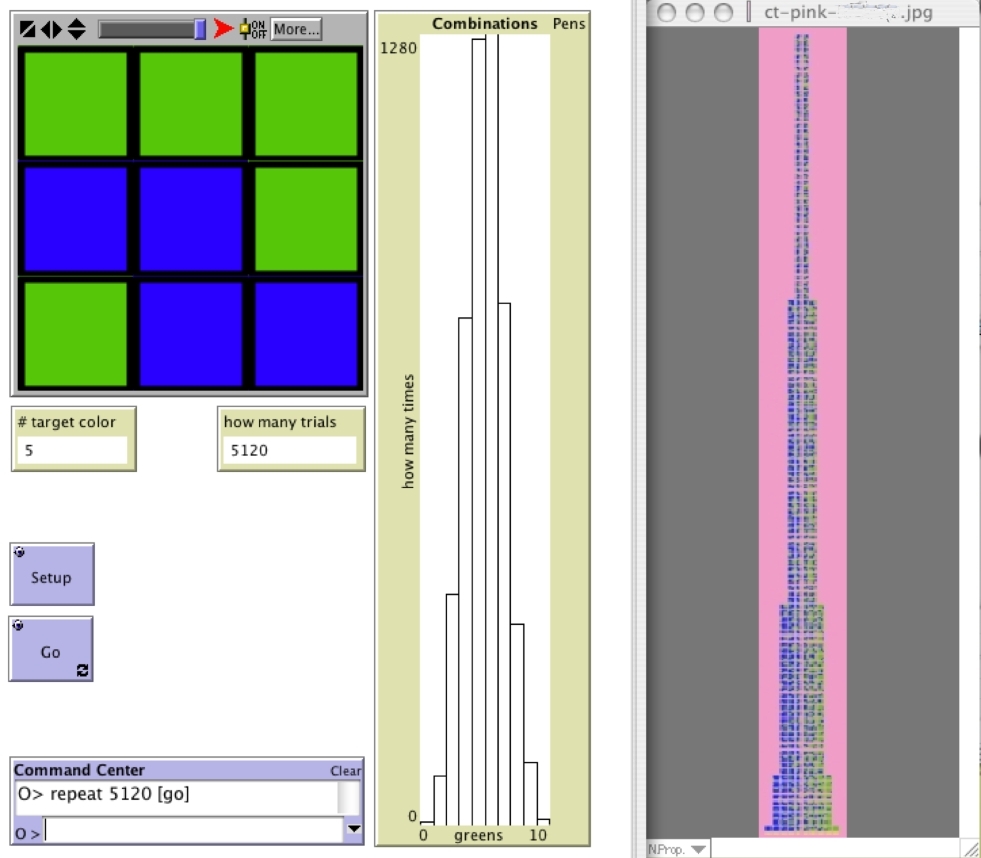
Figure 2: Bridging between empirical and theoretical probability (this is screenshot from a teacher's computer interface that was projected onto the classroom screen). On left, NetLogo 9-Blocks randomly generates 9-blocks. In the center, a histogram accumulates results from this experiment -- it shows the frequency distribution of the number of green squares in each randomly-generated block, beginning from 0-green (the tiny column down on the left of the histogram), and running through 1-green, 2-green, and so on through to 9-green (for a total of 10 columns). This histogram grows before our eyes as we run the model. We see that most samples have been with 4 or 5 green squares (middle columns), less samples have had 3 or 6 green squares, and so on, with the 0-green and 9-green squares constituting the rarest events. On the right is the combinations tower, the product of combinatorial analysis, here in its virtual form, in the 9-Block Stalagmite model (This is a .jpg created on a previous day, when 9-Block Stalagmite was running). Note the similarity between the shapes of the empirically-generated frequency distribution and the theoretically-constructed tower. (In this model, each individual square within the block has a .5 chance of being green. These probabilities are given to modification on the interfaces of other models, such as 9-Block Stalagmite and Stochastic Patchwork).Please keep returning to see what is new. We are currently creating a NetLogo version of the Combinations Tower activity that will look much like the 9-Block Stalagmite model. Also, there will be a HubNet version of this new game in which students work together (or compete) in creating the entire sample space. For further information, write to feedback@ccl.northwestern.edu. Thank you for visiting our site.
[last updated July 8, 2005]