CM ProbLab: 9-Blocks -- Bridging combinatorial analysis, compound events, and frequency distributions
Don't see nothin'?
Gist
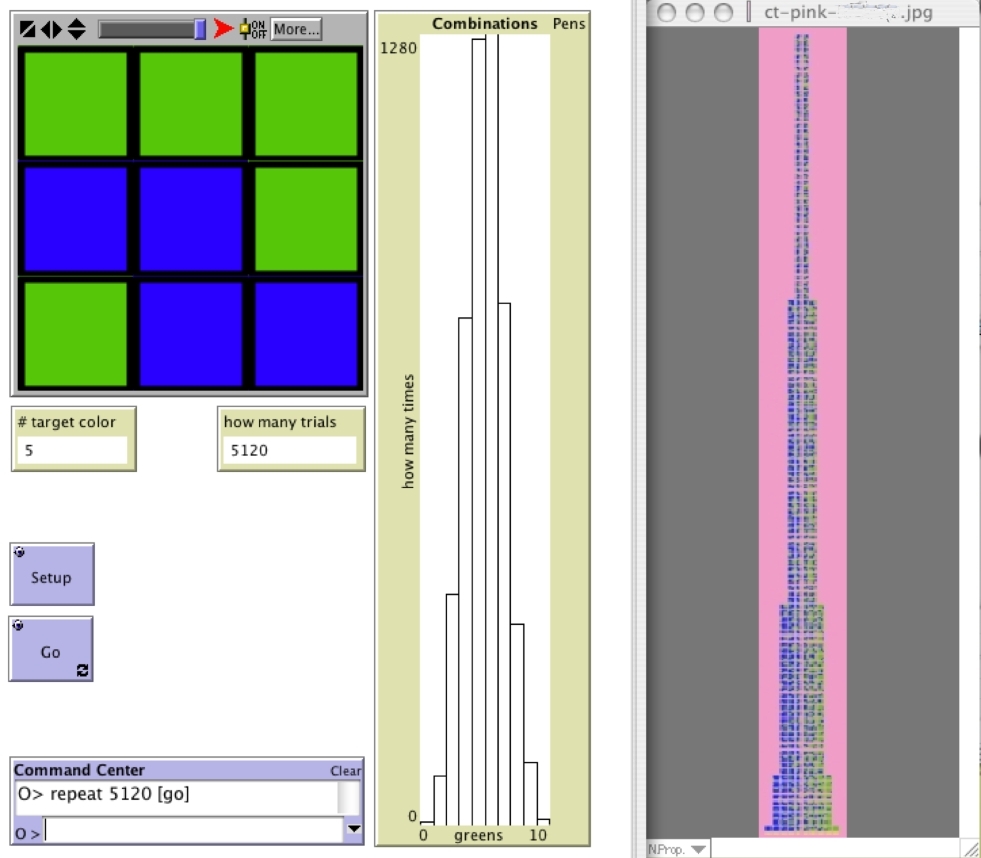
In this model, each square is either green or blue on every trial. The model counts up how many squares are green (the "target color") and the histogram plots how many times we got each number of greens, between 0 and 9. For instance, if your sample has 5 green squares, the '5' column in the histogram will grow a bit.
The "9-Blocks" model helps us shift between two complementary interpretations of the 9-block (the 3-by-3 array of green/blue squares). When the ONE-BY-ONE-CHOICES? switch is set to 'On,' we can think of each color square as a green-or-blue "coin" that settles either on green or blue. In that sense, the 9-block is a set of 9 individual independent events, and we are taking samples of n=9 from a "population" of coins that have either 'green' or 'blue' as their value for the property 'color' that we are measuring ('green' is our arbitrarily chosen favored event or "target color," and the histogram reflects this decision). This is a "population" -- with quotation marks -- because it doesn't really exist until we generate the random sample. Compare this to SAMPLER, where the virtual population exists before we take the samples.
The complementary interpretation of the 9-blocks is as a compound event. There are 512 different permutations of the 9-block (see the Combinations Tower page). The histogram organizes these permutations according to the combinations. For instance, all events of 9-blocks that have exactly 5 green squares are accumulated in the '5' column. So the histogram is showing us the frequency distribution of 9-blocks according to a particular classification that we chose (there could be other classes, such as based on types of rotational symmetries or if the patterns describe letters of the alphabet, etc.). Unlike in 9-Block Stalagmite, the 9-Blocks model does not show the actual samples in the histogram. It is more like the histograms that learners will encounter out of the ProbLab environment. Students who have worked on the Combinations Tower may have intuitions as to why the 4-green and 5-green 9-blocks occur most often in the 9-Blocks model. Young students who have noted the higher frequency of the 4- and 5-green 9-blocks or who have noticed the similarity of the histogram to the Combinations Tower have said, "It's because there are more of those in the world to choose from." Figure 1, below, shows how the 9-Blocks model can be used in conjunction with the Combinations Tower -- the tower that students build in the classroom -- and/or images from the 9-Block Stalagmite model.
Figure 1: A screenshot from a teacher's computer interface that was projected onto the classroom screen. On left, NetLogo 9-Blocks randomly generates 9-blocks. In the center, a histogram accumulates results from this experiment. The question that these comparisons has evoked is, "Why is the histogram the same shape as the Combinations Tower?" This is perhaps the most fundamental learning issue of the domain of probability. It is getting at the meaning of theoretical probability and how it relates to empirical probability. It sheds a new light on the activity of constructing the Combinations Tower. It also invites discussions of the validity of running experiments on a computer (see also Random Basic for a simplified environment for supporting such a discussion).
A model related to 9-Blocks is Stochastic Patchwork. In fact, 9-Blocks can be viewed as a simplified version or specific setting of Stochastic Patchwork. In that model, as in 9-Block Stalagmite, you can control the probability of each square being green. Also, you can control the size of the sample.
[last updated April 7, 2005]