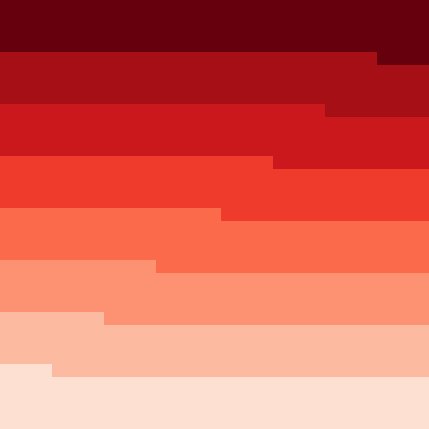
Generated in NetLogo
using scale-schemes
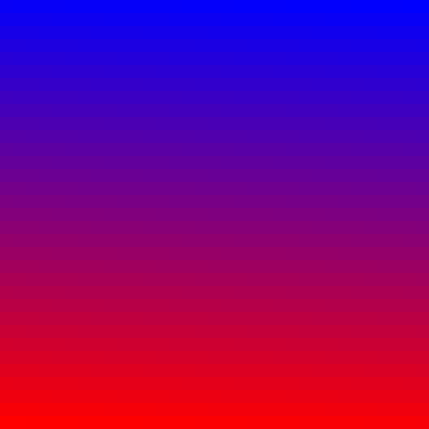
Generated in NetLogo
using scale-gradient
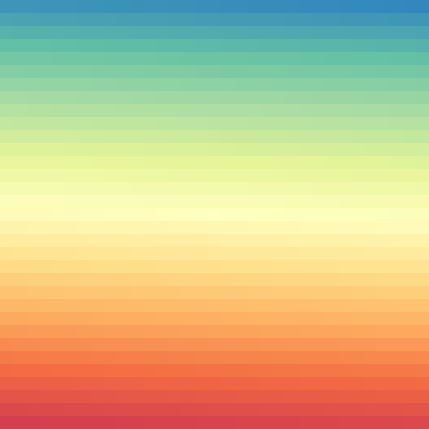
Generated in NetLogo
using scale-gradient with scheme-colors
The NetLogo Pallete Extentions allows to map values to colors. The colors go beyond NetLogo colors, including ColorBrewer color schemes or arbitrary rgb colors. Additionally, it provides a primitive to map to color gradients and a primitive to launch a ColorBrewer dialog for easy scheme selection.
The palette extension requires at least NetLogo 4.0beta5. It will not work with older versions of NetLogo since it requires rgb color support. To install the palette extension for use by any model, place palette's folder in the extensions directory in the NetLogo directory. Or, you can just keep the palette's folder in the same folder as the model that uses it. For more information about other ways of installing an extention refer to the NetLogo Extensions Guide
You can download the palette as the palette.zip compressed file or the palette.tar.gz tar ball.
These screenshots where generated using the Color Gradient Example [applet] in NetLogo.
Generated in NetLogo |
Generated in NetLogo |
Generated in NetLogo |
|
||
To get started with palettes add to the top of your procedures tab:
extensions [palette]
you can then call any of the primitives by adding palette: before the primitive:
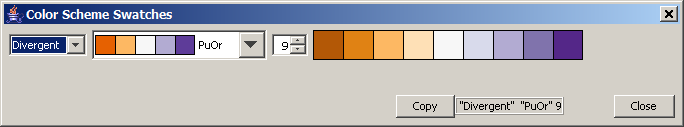
palette:scale-gradient
palette:scale-scheme

palette:scheme-color
palette:scheme-dialog
The palette extentions primitves return a list contaning rgb colors [[r g b][r g b]...[r g b]], except for palette:scheme-dialog which launches a dialog.
ColorBrewer has many colors where to start. ColorBrewer has three schemes Sequencial, Divergent and Qualitative. The use of ColorBrewer for maps is discussed at length in this paper (Harrower, Brewer 2003). Choosing the right colors is a design problem, thus, there are many acceptable solution. However, these guideines might be useful for choosing colors in Agent Based Models:
The answer depends on the task that your will be asking from your user.
For example, gradients are more aesthetical thus are more memorable than discrete colors. Consequently, a gradient can be a better choice for presentations where the main goal of the image is to be attractive and memorable. However, binning values in a discrete set of colors simplifies tasks such as estimation and counting by removing unnecessary detail to display the big picture. Thus, discrete colors can be a better choice for a paper where the user will have the time and interest to study the visualization.
In order to see the difference you can turn on and off the gradient in the Heat Diffusion Applet . You can observe that turning gradient on makes the model more aesthetical, but it becomes harder to estimate the value of a patch at a given position.
Scale-Gradient Applet - Scale-Scheme Example.nlogo
Scale-Gradient Applet - Scale-Gradient Example.nlogo
Color Gradient Applet - Color Gradient Example.nlogo
Heat Diffusion Applet - Heat Difussion.nlogo
Be sure to check to ColorBrewer webpage. To get a deeper understanding of how to use the color schemes read the Colorbrewer paper (Harrower, Brewer 2003
ColorBrewer http://www.colorbrewer.org
HARROWER, M. and C. BREWER (2003). ColorBrewer: An online tool for selecting color schemes for maps. The Cartographic Journal 40(1): 27-37. )
HEALEY, C G (2006) Perception in Visualization, (comprehensive review updated regularly).
HEALEY, C G, BOOTH K S, and ENNS, J T (1995). Visualizing Real-Time Multivariate Data Using Preattentive Processing ACM Transactions on Modeling and Computer Simulation 5, 3, 190-221.
TUFTE, E (1983) The Visual Display of Quantitative Information , Graphics Press.
WARE, C (2004) Information Visualization, 2nd Ed., Morgan Kaufmann.
All feedback is welcomed at dkor a.t northwestern d.o.t edu