
Daniel Kornhauser, William Rand, Uri Wilensky (2009)
Guidelines for Designing Effective Agent Based Model Visualizations
Journal of Artificial Societies and Social Simulation
vol. ??, no. ? ?
<http://jasss.soc.surrey.ac.uk/??/?/?.html>
For information about citing this article, click here
Received: 14-Aug-2008 Accepted: 02-Feb-2009 Published: ??-Jan-2009

 Abstract
| ||
|
Figure 1. Examples of ineffective unaesthetic visualizations versus effective aesthetic visualizations in NetLogo. Note that in the visualizations on the left a), the authors chose to prioritize other criteria: In the Innate Immune Response Model, the author used a red garish background to represent the color of blood. In the Prolab Genetics Model, the author used neon colors given that they tend to captivate the interest of children. In this paper we prioritize cognitively efficient representations above accurate figurative representations or motivational representations. |
|
|||||||||||||||
| Figure 2. Conventional ABM visualizations encompass well-established mathematical representations or natural phenomena. The viewer understands these graphical representations only because he/she has seen or studied similar representations previously |
|
||||||||||||
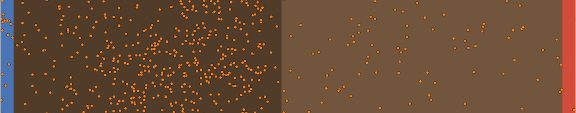
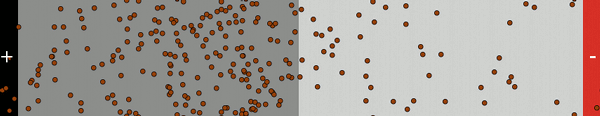
| Figure 3. Unstructured ABM visualizations appear as irregular spatial patterns. They mostly convey information through the perception of the change of color, texture or spatial distribution of the composition. They are mostly characterized by an irregular spatial distribution of agents. |
|
|||||||||||||||||||||||||||
| Figure 4. Structured ABM visualizations form an abstract or figurative shape or regular pattern. These visualizations are characterized by a regular spatial positioning of agents creating clusters, regions, aggregations, or particle trajectories. |
|
Common Fate: These are three frames of an animation in them you can perceive the groups of Boids moving together from the top right corner to the bottom left corner. This flocking model (Wilensky 1998f) based on Reynolds classic Boids (Reynolds, 1987) is at http://ccl.northwestern.edu/netlogo/models/Flocking. |
|
|||||||||||||||||||||||||||||||||||||
| Figure 7. Bertin's Visual Variables illustrated with NetLogo. An interactive applet, which changes each visual variable individually, can be viewed at http://ccl.northwestern.edu/papers/ABMVisualizationGuidelines/VisualVariables/. |
|
||||||||||||||||||||||||||||||||||||||
| Figure 8. Visual Variables Characteristics of Turtles. An interactive applet can be viewed at http://ccl.northwestern.edu/papers/ABMVisualizationGuidelines/VisualVariablesProperties/ . |
|
||||||||||||||||||||||||||
| Figure 9Visual Variable Characteristics of Patches. An interactive applet can be viewed at http://ccl.northwestern.edu/papers/ABMVisualizationGuidelines/VisualVariablesProperties/ . |
|
||||||||
|
Figure 10Examples of transparency, textures, resolution, and crispness in ABM visualizations. (We created these images using experimental NetLogo builds, except for Figure 10-d on the right where we blurred a screenshot with a graphics program) | ||||||||
|
||||||||||||||||||||||||||||||||
Figure 11. Examples of target detection, boundary detection, and counting & estimation tasks in NetLogo Models. The Disease Solo Model (Wilensky 2005) is at Wilensky 1998g) is at . The Radioactive Decay Model (Wilensky 1998h) is at http://ccl.northwester10.7Visual interference
|
|
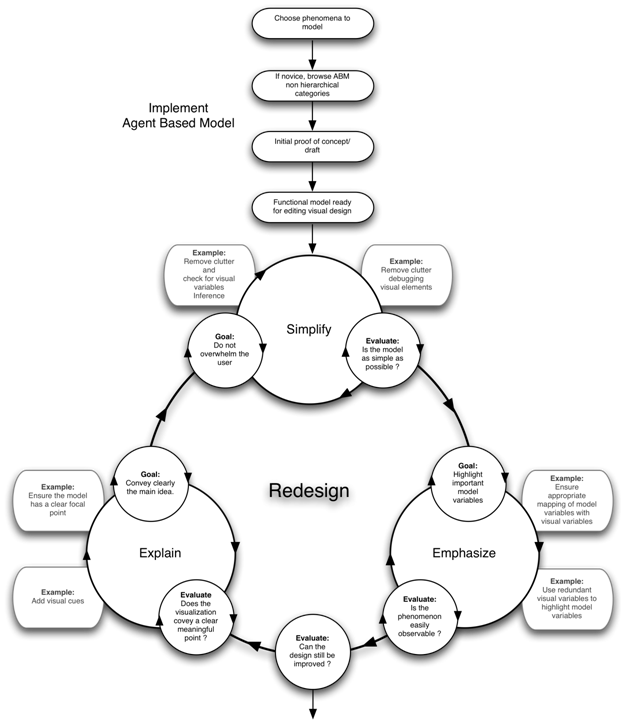
| Figure 13. Generic design workflow of an ABM visualization. Initial implementation of the model followed by an iterative redesign composed by 3 steps Simplify, Emphasize, and Explain. |
|
|||||||||||||||||||
Figure 14. Several views of the Rumor Mill Model: This model shows how a rumor spreads. The rumor spreads when a person (represented by a patch) tells a rumor to a neighbor (represented by an adjacent patch). At each time step, every person who knows the rumor randomly chooses a neighbor to tell the rumor to diffuse. You can view the Rumor Mill Model (Wilensky 1998c) at 11.10
Explain
|
|
| Figure 17. Initial visualization redesign of Series Circuit Model |
|
| Figure 18. Foreground enhancement of Series Circuit Model |
|
| Figure 19. Foreground enhancement of Series Circuit Model |
|
| Figure 20. Foreground enhancement of Series Circuit Model |
|
| Figure 21. Final design of Series Circuit Model |
ANDRIENKO, G L (1999) Interactive maps for visual dataexploration, International Journal of Geographical Information Science,vol. 13, issue 4, p 355.
ALBERS, J (1975) Interaction of Color. Yale University Press,New Haven, CT.
BERTIN, J (1967) S�miologie graphique, Paris-DenHaag: Mouton.
BERTIN, J (1983) Semiology of Graphics, Translated by W. Berg, Universityof Wisconsin Press.
BRATH, R (1997) Metrics for effective information visualization,Proceedings of the 1997 IEEE Symposium on Information Visualization (InfoVis'97), p.108, October 18-25.
BRATH, R M Peters and R Senior, (2005) Visualization forCommunication: The Importance of Aesthetic Sizzle, IEEE IV05.
BACH, M, Poloschek CM (2006) Optical Illusions. Adv Clin NeurosciRehab (ACNR) 6:20�21.
BACH, M (1997-2) 67 Optical Illusions & Visual Phenomena. Lastupdated 26-Nov-2006. Retrieved December 1, 2006, from Bach Micheal's web site: http://www.michaelbach.de/ot/index.html
CALLAGHAN, T. C. (1989) Interference and domination in texture segregation: Hue, geometric form, and line orientation. Percep. Psychophys. 46, 4, 299-311.
CARPENDALE, M S T (2003) Considering visual variables as a basisfor information visualization. Technical Report 2001-693-16, Departmentof Computer Science, University of Calgary, Calgary, Canada.
COBB T, (1997) Cognitive efficiency: Toward a revised theory ofmedia. Educational Technology Research & Development, 45 (4), 21-35.
COLBY G, Scholl L, (1991) Transparency and blur as selective cuesfor complex visual information, �SPIE Vol. 1460, Image Handling andReproduction Systems Integration, pages 114�125.
GOLDSTEIN, E B (1999) Sensation and Perception (5th Edition). Brooks/Cole Publishing.
HARROWER, M A & Brewer C A, (2003) ColorBrewer.org: An OnlineTool for Selecting Color Schemes for Maps, The Cartographic Journal 40(1): 27-37.
HEALEY, C G, Booth K S, & Enns, J T (1995). VisualizingReal-Time Multivariate Data Using Preattentive Processing ACM Transactionson Modeling and Computer Simulation 5, 3, 190-221.
HEALEY, C G, Booth K S, & Enns J T (1996) High-Speed VisualEstimation Using Preattentive Processing ACM Transactions on Human ComputerInteraction 3, 2, 107-135.
HEALEY, C G, St. Amant R, & Elhaddad M. (1999)"ViA: APerceptual Visualization Assistant." In Proceedings 28th AppliedImagery Pattern Recognition Workshop, (Washington, D.C., pp. 1-11.
HEALEY, C G (2006) Perception in Visualization, Last updated17-Jan-2007. Retrieved December 1, 2006, from Christopher Haley�s web site: http://www.csc.ncsu.edu/faculty/healey/PP/index.html
(comprehensive review updated regularly).
ITTEN, J (1970) The Elements of Color. Van Nostrand ReinholdCompany, New York, NY.
JONES, C (1998) Geographical Information Systems and ComputerCartography, Longman, Harlow, England.
JULESZ, B (1986) Texton gradients: The texton theory revisited, BiologicalCybernetics, vol. 54, pp. 245-251
KLEIN, J (2002) Breve: a 3D simulation environment for thesimulation of decentralized systems and artificial life. Proceedings ofArtificial Life VIII, the 8th International Conference on the Simulation andSynthesis of Living Systems. The MIT Press.
KOSARA R, Miksch S, Hauser and H, (2001) Semantic Depth of Field, Proc.IEEE Symp. Information Visualization (InfoVis2001), IEEE CS Press, LosAlamitos, Calif., pp. 97- 104.
KOREIN J, Badler N, (1983) Temporal anti-aliasing in computergenerated animation, Proceedings of the 10th annual conference on Computergraphics and interactive techniques, p.377-388, July 25-29, Detroit, Michigan, United States
LUKE, S, Catalin Balan G, Panait L, Cioffi-Revilla C, and Paus S (2003)MASON: A Java Multi-Agent Simulation Library, Proceedings of the Agent 2003Conference.
LOHSE, G L Biolsi, K. Walker, N. Rueter, H. H. (1994)� " AClassification of Visual Representations", VOL 37; NUMBER 12, pages 36,ACM Communications.
MAEDA, J (1999) Design by Numbers, The MIT Press.
MINAR N, R Burkhart, C Langton, and M AskenazI (1996) The Swarmsimulation system: a toolkit for building multi-agent simulations. WorkingPaper 96-06-042, Santa Fe Institute, Santa Fe.
NESBITT, K V, Friedrich C. (2002) Applying Gestalt Principles toAnimated Visualizations of Network Data. Proc. IV 2002, IEEE ComputerSociety Press, London, UK, 10-12 July.
NORTH, M J , N T Collier, and J.R. Vos, (January 2006)"Experiences Creating Three Implementations of the Repast Agent ModelingToolkit," ACM Transactions on Modeling and Computer Simulation,Vol. 16, Issue 1, pp. 1-25, ACM, New York, New York, USA.
MACEACHREN, A (1995) How Maps Work, The Guilford Press.
NORMAN, D A (2004). Emotional design: why we love (or hate)everyday things. New York: Basic Books.
PIPES, A (2004) Foundations of Art and Design, Laurence KingPublishing.
RESNICK, M (1994) Turtles, Termites, and Traffic Jams, MITPress, Cambridge.
REYNOLDS, W C (July 1987) Flocks, herds and schools: A distributedbehavioral model, Volume 21,� Issue 4, Pages: 25 � 34, Year of Publication:1987.
RUCKERS, R (1993) Artificial Life Lab, Waite Group Press.
SCHELLING, T. (1978). Micromotives and Macrobehavior. New York:Norton.
TISUE, S. & WILENSKY U. (2004). NetLogo: Design andimplementation of a multi-agent modeling environment, Proceedings of Agent2004.
TUKEY, J (1977) Exploratory Data Analysis, Addison-Wesley.
TUFTE, E (1983) The Visual Display of Quantitative Information, GraphicsPress.
TUFTE, E (1996). Visual Explanation, Graphic Press,Cheschire, Conn.
TUFTE, E (2006). Beautiful evidence, Graphic Press,Cheschire, Conn.
WARE, C (2004). Information Visualization, 2nd Ed., MorganKaufmann.
WARE, C, (2002). Purchase H, Colpoys L and McGill M, Cognitivemeasurements of graph aesthetics, Information Visualization.
WERTHEIMER, M (1923). Untersuchungen zur Lehre von der Gestalt, II(Laws of organization in perceptual forms). PsycholocheForschung, 4, 301-350. Excerpts translated and reprinted in W. D.Ellis (Ed.), A source book of Gestaltpsychology (pp. 71-88). New York: Harcourt, Brace and Co., 1939.
WILENSKY, U (2001) Modeling Nature�s Emergent Patterns withAgent-Based Languages, Proceedings of Eurologo 2001.
WILENSKY, U. and Reisman, K. (2006). Thinking like a wolf, a sheepor a firefly: Learning biology through constructing and testing computationaltheories. Cognition & Instruction, 24(2), 171-209.
ABRAHAMSON, D andWILENSKY, U (2004).NetLogo ProbLab Genetics model.
http://ccl.northwestern.edu/netlogo/models/ProbLabGenetics. Center for Connected Learning and Computer-Based Modeling,Northwestern University, Evanston, IL.
AN, G (2004). Innate Immune Response Department of Trauma, CookCounty Hospital.
http://ccl.northwestern.edu/netlogo/models/community/InnateImmune Response
KORNHAUSER, D (2007). NetLogo Palette Extension
SENGUPTA, P & Wilensky, U (2007). NetLogo Series Circuitmodel.
http://ccl.northwestern.edu/netlogo/models/SeriesCircuit.Center for Connected Learning and Computer-Based Modeling, NorthwesternUniversity, Evanston, IL.
WILENSKY, U (1999a). NetLogo.
�WILENSKY, U (1999b). NetLogo Models Library. WILENSKY, U (2005). NetLogo Disease Solo model.
WILENSKY, U (2004a). NetLogo DLA model.
WILENSKY, U (2006). NetLogo Ethnocentrism model.
http://ccl.northwestern.edu/netlogo/models/Ethnocentrism.
Center for Connected Learning and Computer-Based Modeling, NorthwesternUniversity, Evanston, IL.
WILENSKY, U (2004b). NetLogo Heatbugs model.
WILENSKY, U (1998a). NetLogo Virus model.
WILENSKY, U (1998b). NetLogo Heat Diffusion model.
http://ccl.northwestern.edu/netlogo/models/HeatDiffusion.Center for Connected Learning and Computer-Based Modeling, NorthwesternUniversity, Evanston, IL.
WILENSKY, U (1998c). NetLogo Rumor Mill model.
WILENSKY, U (1998d). NetLogo Voting model.
WILENSKY, U (1998e). NetLogo Termites model.
WILENSKY, U (1998f). NetLogo Flocking model.
WILENSKY, U (1998g). NetLogo Segregation model.
WILENSKY, U (1998h). NetLogo Decay model.
WILENSKY, U (1998i). NetLogo Simple Kinetics 1 model.
http://ccl.northwestern.edu/netlogo/models/SimpleKinetics1.Center for Connected Learning and Computer-Based Modeling, NorthwesternUniversity, Evanston, IL.
 Return to Contents of this issue
© Copyright Journal of Artificial Societies and Social Simulation, [2009]


